SpringBoot Prometheus Grafana 监控对接
# 简介
环境:dev,引入监控工具链,Prometheus、Grafana的构建和部署
版本:最新版
成品页面地址:http://124.70.95.70/grafana/d/sbapmwalker/springboot-apm-dashboard?orgId=1&from=now-30m&to=now
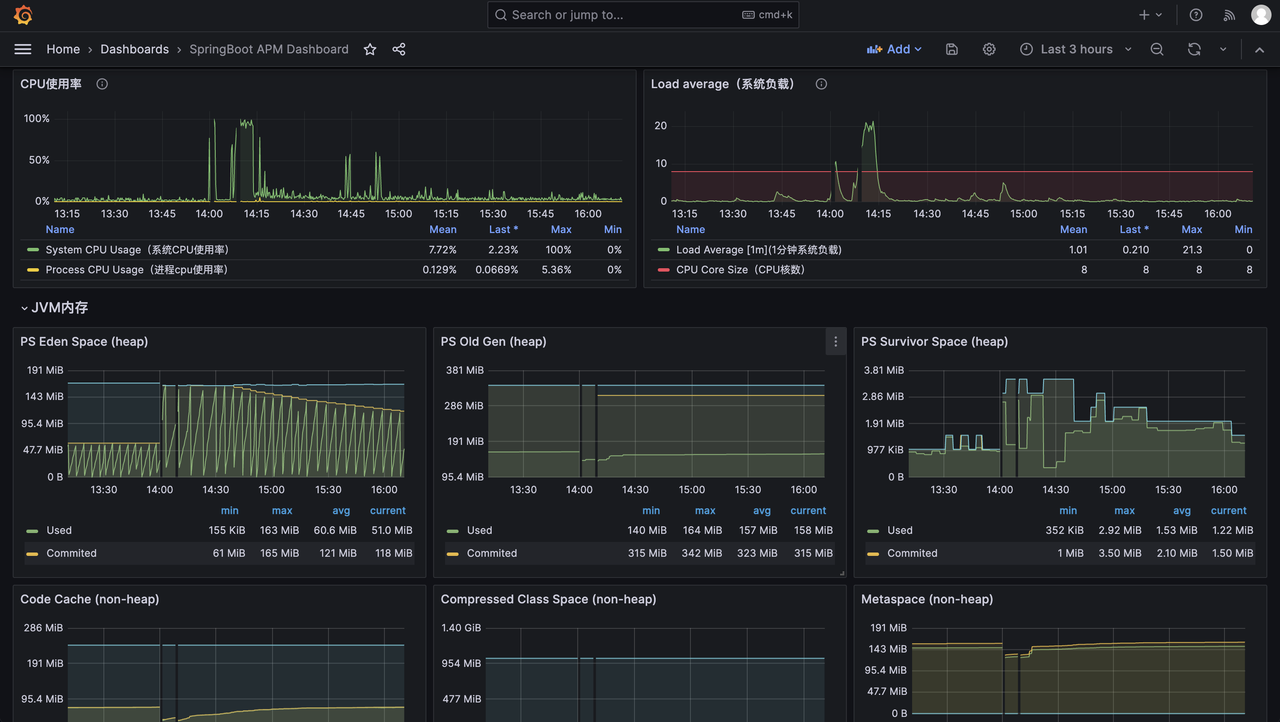
# Java 服务监控


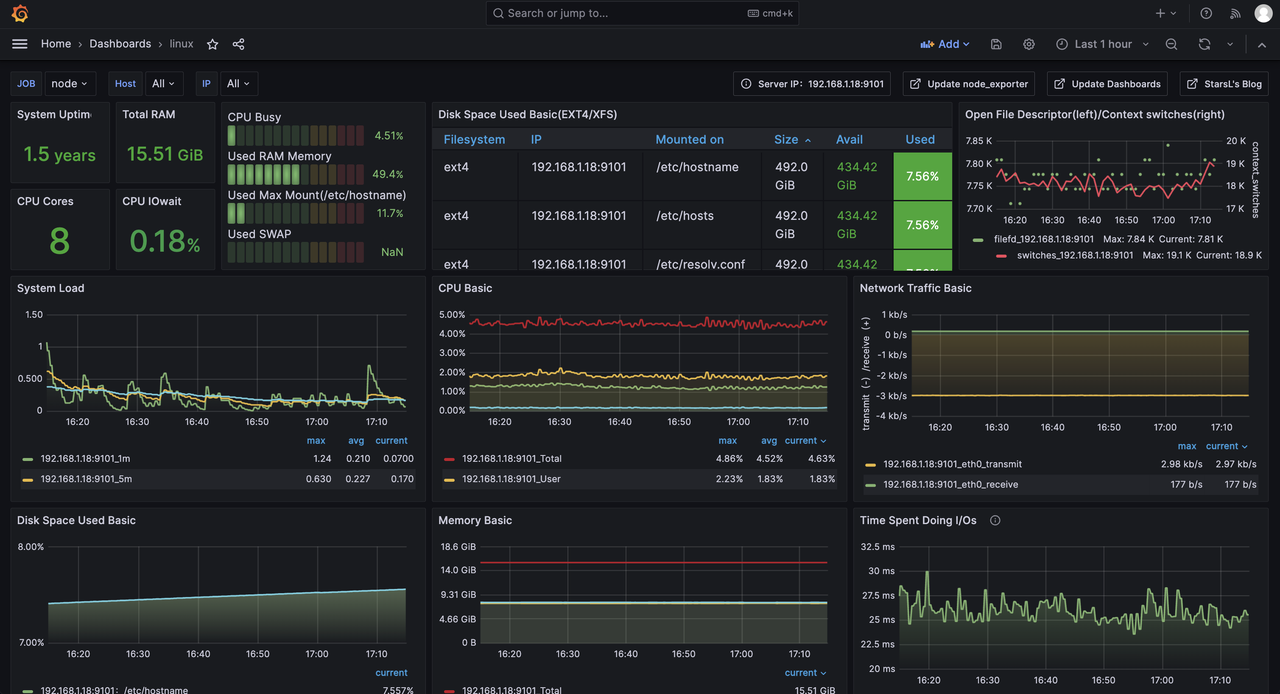
# 服务器主机监控
# Prometheus Grafana 搭建
# 部署文件
version: '2'

networks:
    monitor:
        driver: bridge

services:
    prometheus:
        image: prom/prometheus
        container_name: prometheus
        hostname: prometheus
        restart: always
        environment:
            - TZ=Asia/Shanghai
        volumes:
            - ./prometheus/config:/etc/prometheus
            - ./prometheus/data:/prometheus
            - /etc/localtime:/etc/localtime:ro
            - /etc/timezone:/etc/timezone:ro
        command:
            - '--config.file=/etc/prometheus/prometheus.yml'
            - '--storage.tsdb.path=/prometheus'
            - '--web.enable-lifecycle'
        ports:
            - "9090:9090"
        networks:
            - monitor

    grafana:
        image: grafana/grafana
        container_name: grafana
        hostname: grafana
        restart: always
        environment:
            - GF_SECURITY_ADMIN_USER=admin
            - GF_SECURITY_ADMIN_PASSWORD=admin
            - GF_AUTH_PROXY_ENABLED=true
#            - GF_SERVER_SERVE_FROM_SUB_PATH=true
            - GF_SERVER_ROOT_URL=http://localhost:3000/grafana
            - TZ=Asia/Shanghai
        ports:
            - "3001:3000"
        volumes:
            - ./grafana:/var/lib/grafana
        networks:
            - monitor
2
3
4
5
6
7
8
9
10
11
12
13
14
15
16
17
18
19
20
21
22
23
24
25
26
27
28
29
30
31
32
33
34
35
36
37
38
39
40
41
42
43
44
45
46
Prometheus 配置文件
global:
  scrape_interval:     10s # 每30s采集一次数据
  evaluation_interval: 10s # 每30s做一次告警检测

# 告警服务
alerting:
  alertmanagers:
  - static_configs:
    - targets: ["192.168.1.18:9093"]

# 告警规则文件
rule_files:
  - "*_rules.yml"

scrape_configs:
  - job_name: 'prometheus'
    static_configs:
      - targets: [ '192.168.1.18:9090' ]
        labels:
          instance: prometheus
  - job_name: 'cadvisor'
    static_configs:
      - targets: [ '192.168.1.18:8899' ]
  - job_name: 'cc2-dev-中间件'
    static_configs:
      - targets: [ '192.168.1.18:9101' ]
  - job_name: 'dky-admin'
    scrape_interval: 15s
    scrape_timeout: 10s
    metrics_path: '/admin/actuator/prometheus'
    static_configs:
      - targets: [ '192.168.0.10:8300' ]
        labels:
          env: dev
          project: DkCloud
  - job_name: 'dky-ws-sdk'
    scrape_interval: 15s
    scrape_timeout: 10s
    metrics_path: '/actuator/prometheus'
    static_configs:
      - targets: [ '192.168.0.10:8111', '192.168.0.10:8112' ]
        labels:
          env: dev
          project: DkCloud
  - job_name: 'dky-open-api'
    scrape_interval: 15s
    scrape_timeout: 10s
    metrics_path: '/actuator/prometheus'
    static_configs:
      - targets: [ '192.168.0.10:8091' ]
        labels:
          env: dev
          project: DkCloud
  - job_name: 'dky-gateway'
    scrape_interval: 15s
    scrape_timeout: 10s
    metrics_path: '/actuator/prometheus'
    static_configs:
      - targets: [ '192.168.0.10:8000' ]
        labels:
          env: dev
          project: DkCloud
2
3
4
5
6
7
8
9
10
11
12
13
14
15
16
17
18
19
20
21
22
23
24
25
26
27
28
29
30
31
32
33
34
35
36
37
38
39
40
41
42
43
44
45
46
47
48
49
50
51
52
53
54
55
56
57
58
59
60
61
62
# SpringBoot 对接
# 添加依赖
<dependency>
    <groupId>org.springframework.boot</groupId>
    <artifactId>spring-boot-starter-actuator</artifactId>
</dependency>
<dependency>
    <groupId>io.micrometer</groupId>
    <artifactId>micrometer-registry-prometheus</artifactId>
</dependency>
2
3
4
5
6
7
8
# 更新配置
management:
  endpoints:
    web:
      exposure:
        include: "*"
  endpoint:
    health:
      show-details: always
2
3
4
5
6
7
8
# Prometheus nacos 动态拉取微服务监控
20251021 使用 Prometheus 自带的 http_sd 从 nacos 动态拉取注册的 java 微服务进行监控。(需要 naocs 高版本支持,具体版本忘了,我直接从 2.2.x 升级到 2.5.x 最新版)
这样就省去了每次还需要手动配置监控节点的操作。尤其是上云之后节点都是弹性动态可伸缩的。
nacos http_sd 官网:https://nacos.io/en/docs/next/ecology/use-nacos-prometheus-sd/
# nacos 开启 http_sd 功能
management.endpoints.web.exposure.include=*
nacos.prometheus.metrics.enabled=true
2
# spring boot 添加 nacos 标签
spring:
  application:
    name: @project.artifactId@
  profiles:
    active: @profile.active@
  cloud:
    nacos:
      username: @nacos.username@
      password: @nacos.password@
      discovery:
        namespace: @nacos.namespace@
        server-addr: @nacos.server-addr@
        metadata:
          project: DkCloud
          application: ${spring.application.name}
          app_metrics_path: ${server.servlet.context-path:/}/actuator/prometheus
          env: ${spring.profiles.active}
          job: ${spring.application.name}
      config:
        enabled: true
        server-addr: @nacos.config.server-addr@ # 配置中心
        namespace: @nacos.config.namespace@ # 命名空间的id
        file-extension: yaml # 配置文件格式
2
3
4
5
6
7
8
9
10
11
12
13
14
15
16
17
18
19
20
21
22
23
# Prometheus http_sd_configs 配置
global:
  scrape_interval:     10s # 每30s采集一次数据
  evaluation_interval: 10s # 每30s做一次告警检测

# 告警服务
alerting:
  alertmanagers:
  - static_configs:
    - targets: ["192.168.1.18:9093"]

# 告警规则文件
rule_files:
  - "*_rules.yml"

scrape_configs:
  # - job_name: 'dky-call-test'
  #   scrape_interval: 15s
  #   scrape_timeout: 10s
  #   metrics_path: '/actuator/prometheus'
  #   static_configs:
  #     - targets: [ '192.168.0.10:5251' ]
  #       labels:
  #         env: dev
  #         project: DkCloud

  # 手动校验:curl -u nacos:nacos "http://192.168.0.10:8848/nacos/prometheus/namespaceId/45138bce-488c-4849-95a6-a2d63f56aaa7"
  - job_name: 'dk-cloud-开发环境'
    http_sd_configs:
      - url: 'http://192.168.0.10:8848/nacos/prometheus/namespaceId/45138bce-488c-4849-95a6-a2d63f56aaa7'
        refresh_interval: 10s
        basic_auth:
          username: 'nacos'
          password: 'nacos'
    relabel_configs:
      - source_labels: [app_metrics_path]
        regex: '//(.*)'
        replacement: '/${1}'
        target_label: app_metrics_path
        action: replace
      - source_labels: [app_metrics_path]
        regex: '(/.*)'
        replacement: '${1}'
        target_label: __metrics_path__
        action: replace
2
3
4
5
6
7
8
9
10
11
12
13
14
15
16
17
18
19
20
21
22
23
24
25
26
27
28
29
30
31
32
33
34
35
36
37
38
39
40
41
42
43
44
# 刷新 Prometheus 配置文件
curl -X POST http://127.0.0.1:9090/-/reload
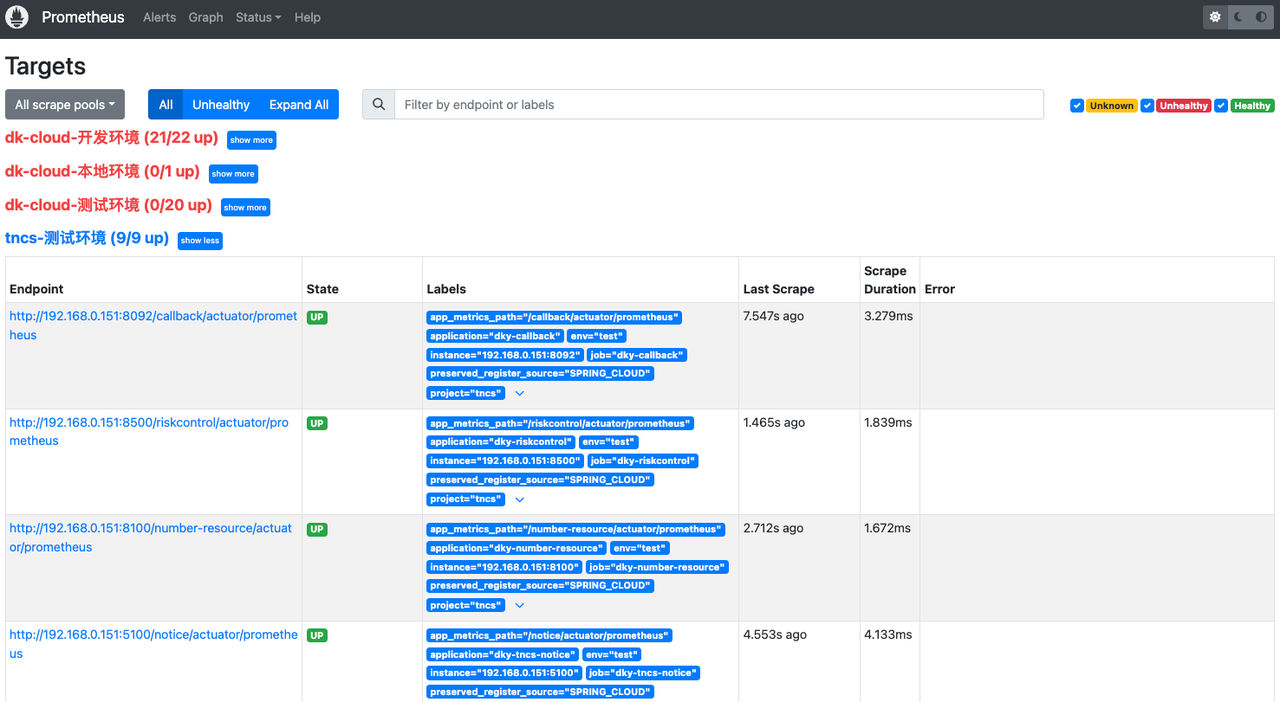
查看 Prometheus 监控
http://124.70.95.70/prometheus/targets?search=
# 配置 grafana 监控模板
使用的是这个模版:https://grafana.com/grafana/dashboards/21319-springboot-apm-dashboard/
更新如下变量,支持按项目、环境、应用查看对应服务监控。
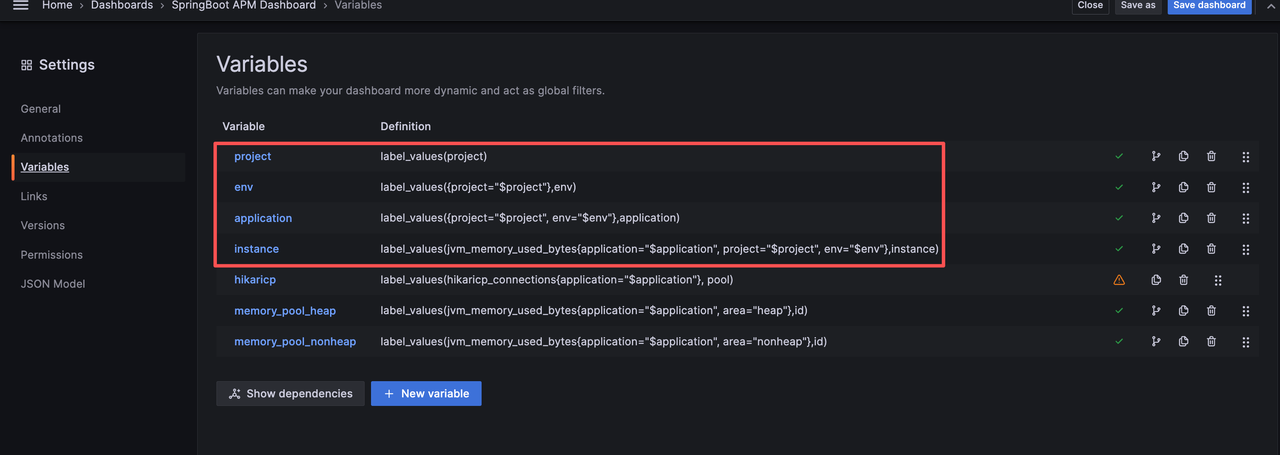
# 查看 grafana 监控详情
项目、环境、应用,支持级联关系

# 遇到问题及解决
# 自定义 json 转换器兼容
Java 服务对接监控的过程中,同样的配置,出现了有的服务能监控到,有的服务监控不到的问题。(自定义的fastjson转换器需要兼容)
@Configuration
public class MyFastJsonConfiguration extends WebMvcConfigurationSupport {

    @Override
    public void configureMessageConverters(List<HttpMessageConverter<?>> converters) {
        FastJsonHttpMessageConverter converter = new FastJsonHttpMessageConverter();
        FastJsonConfig config = new FastJsonConfig();
        config.setSerializerFeatures(
            // 保留map空的字段
            SerializerFeature.WriteMapNullValue,
            // 将String类型的null转成""
            SerializerFeature.WriteNullStringAsEmpty,
            // 将Number类型的null转成0
            SerializerFeature.WriteNullNumberAsZero,
            // 将List类型的null转成[]
            SerializerFeature.WriteNullListAsEmpty,
            // 将Boolean类型的null转成false
            SerializerFeature.WriteNullBooleanAsFalse,
            // 避免循环引用
            SerializerFeature.DisableCircularReferenceDetect);

        converter.setFastJsonConfig(config);
        converter.setDefaultCharset(Charset.forName("UTF-8"));
        List<MediaType> mediaTypeList = new ArrayList<>();
        // 解决中文乱码问题,相当于在Controller上的@RequestMapping中加了个属性produces = "application/json"
        mediaTypeList.add(MediaType.APPLICATION_JSON);
        converter.setSupportedMediaTypes(mediaTypeList);
        converters.add(new StringHttpMessageConverter(StandardCharsets.UTF_8));
        converters.add(converter);
    }
}
2
3
4
5
6
7
8
9
10
11
12
13
14
15
16
17
18
19
20
21
22
23
24
25
26
27
28
29
30
31
# swagger 兼容
引入监控依赖后,导致用到 swagger 的服务起不来(Spring boot 2.6.x\2.7.x)。需要兼容一下:
/**
 * 解决 Spring Boot 与 Swagger 不兼容问题
 **/
@Bean
public WebMvcEndpointHandlerMapping webEndpointServletHandlerMapping(WebEndpointsSupplier webEndpointsSupplier, ServletEndpointsSupplier servletEndpointsSupplier, ControllerEndpointsSupplier controllerEndpointsSupplier, EndpointMediaTypes endpointMediaTypes, CorsEndpointProperties corsProperties, WebEndpointProperties webEndpointProperties, Environment environment) {
    List<ExposableEndpoint<?>> allEndpoints = new ArrayList();
    Collection<ExposableWebEndpoint> webEndpoints = webEndpointsSupplier.getEndpoints();
    allEndpoints.addAll(webEndpoints);
    allEndpoints.addAll(servletEndpointsSupplier.getEndpoints());
    allEndpoints.addAll(controllerEndpointsSupplier.getEndpoints());
    String basePath = webEndpointProperties.getBasePath();
    EndpointMapping endpointMapping = new EndpointMapping(basePath);
    boolean shouldRegisterLinksMapping = this.shouldRegisterLinksMapping(webEndpointProperties, environment, basePath);
    return new WebMvcEndpointHandlerMapping(endpointMapping, webEndpoints, endpointMediaTypes, corsProperties.toCorsConfiguration(), new EndpointLinksResolver(allEndpoints, basePath), shouldRegisterLinksMapping, null);
}

private boolean shouldRegisterLinksMapping(WebEndpointProperties webEndpointProperties, Environment environment, String basePath) {
    return webEndpointProperties.getDiscovery().isEnabled() && (StringUtils.hasText(basePath) || ManagementPortType.get(environment).equals(ManagementPortType.DIFFERENT));
}
2
3
4
5
6
7
8
9
10
11
12
13
14
15
16
17
18
19
# 无 jvm 等指标
http://120.46.211.154:8200/cdr/actuator/prometheus
访问 metrics 接口,返回的大部分都是 `lettuce` 开头的指标。(猜测是影响了默认的指标配置)
tncs 监控对接 naocs,redis 依赖改为 redisson(已合到test),代码无改动。防止影响 jvm 等监控指标的暴露
<dependency>
    <groupId>org.redisson</groupId>
    <artifactId>redisson-spring-boot-starter</artifactId>
    <version>3.18.0</version>
</dependency>
2
3
4
5

# 后续计划
无

「真诚赞赏,手留余香」
# 打赏记录
| 打赏者 | 打助金额 (元) | 支付方式 | 时间 | 备注 |
|---|---|---|---|---|
| John | 12 | 微信 | 2020-06-09 | |
| 艾斯 | 32 | 支付宝 | 2020-07-11 | nice |
| HickSalmon | 15 | 微信 | 2020-09-21 | 有赏交流 |
- 03
- 未来 10 年,哪些工作会被替代?哪些更稳?我们到底该焦虑什么04-15